Your workshop analysis and summary, explained
A workshop analysis and summary explained: the living analysis every conversation carries while it runs, and the analys you make on purpose afterwards, over the parts you choose, with its four parts (text, insight report, presentation, sketchnote) and what each is for.
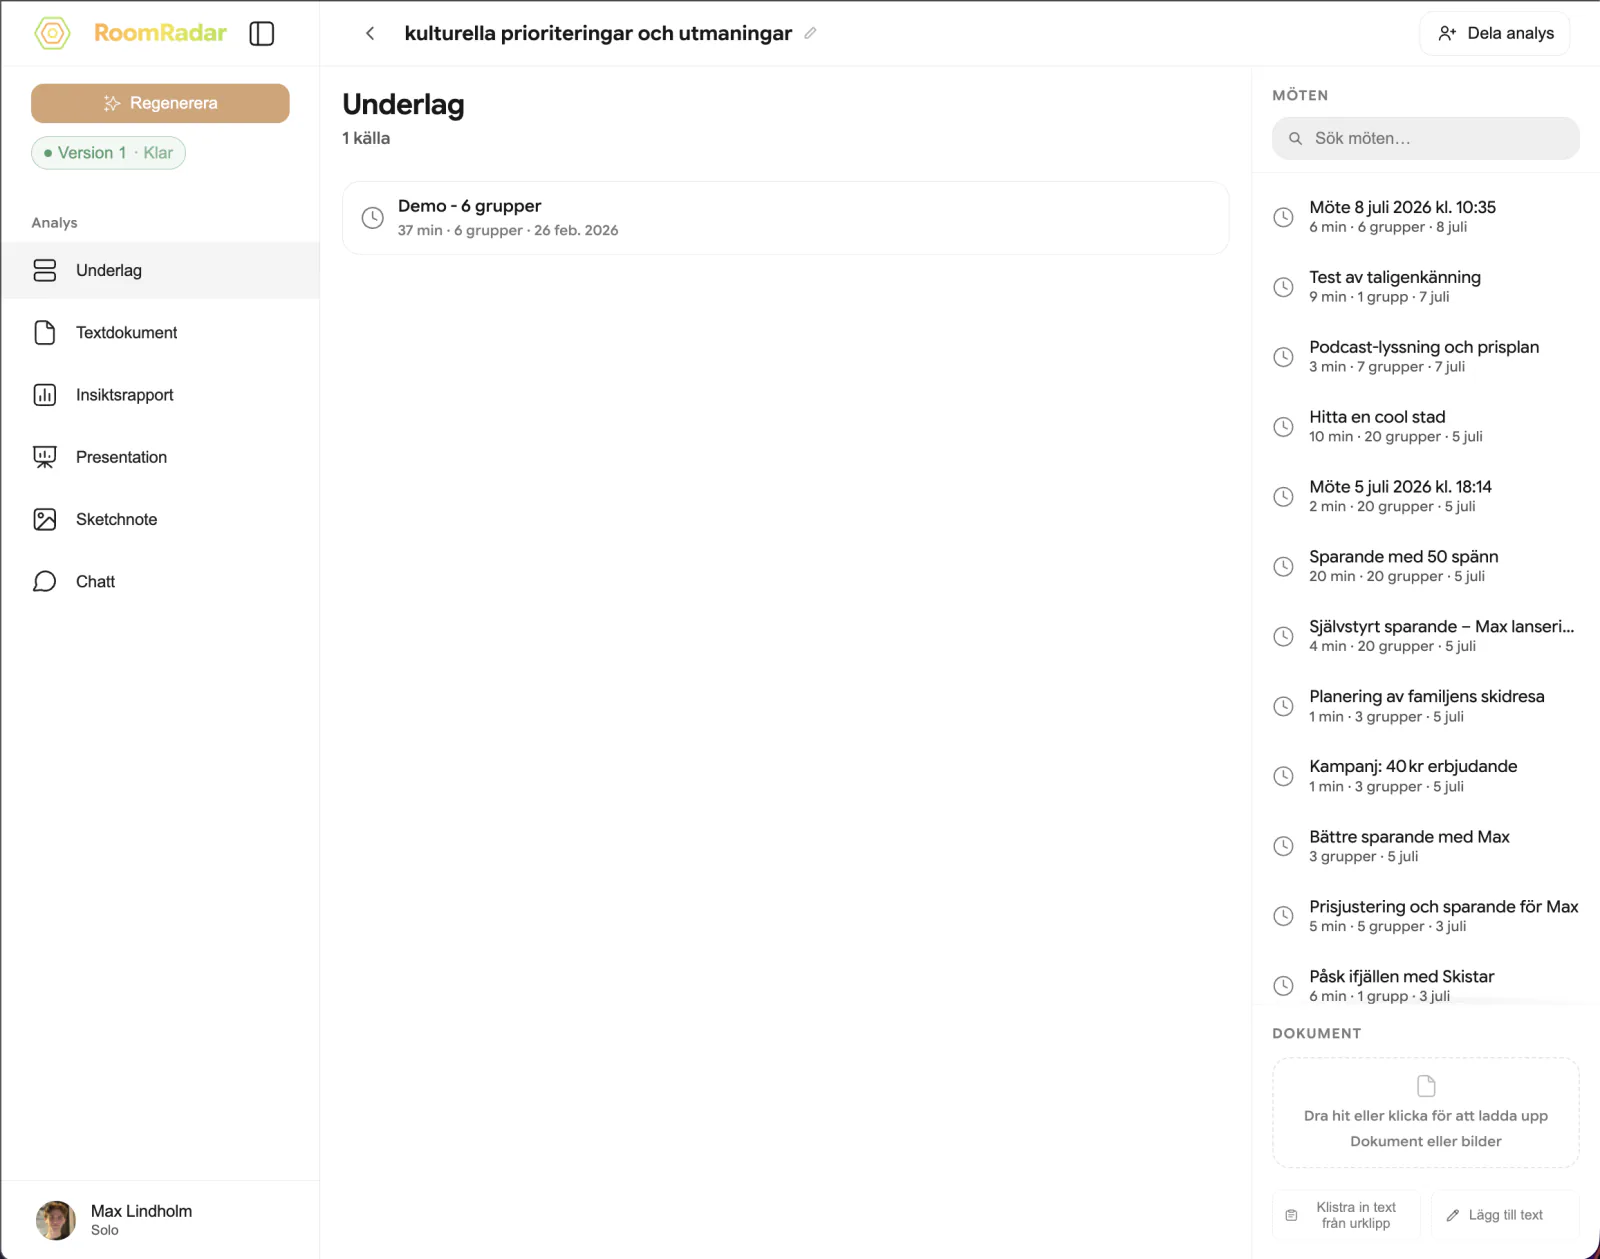
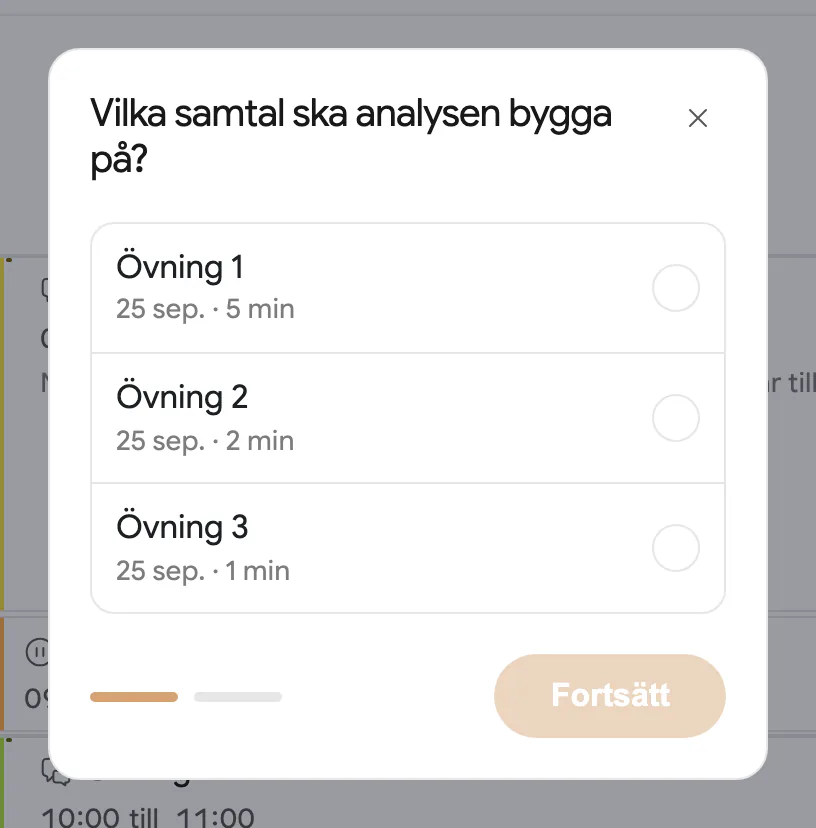
RoomRadar records every table at once and turns the transcripts into two kinds of analysis. The living analysis is on the conversation itself: while people talk, each group's page fills with its positions, what it has arrived at and where its time went, and afterwards you can create a written summary or a sketchnote of any range with Skapa. An analys is different: a deliverable you make on purpose from the workshop's sidebar with Ny analys, over the parts you choose, frozen at that moment, with up to four parts, and shareable as a thing. This guide is about the second, and how it relates to the first.
Living analysis versus an analys
- The living analysis updates itself during a conversation and stays on its group pages and overview afterwards. Nobody presses anything. Its summary and sketchnote are made on demand for a range, and every one you make is kept. See how live summaries work.
- An analys is made deliberately, over one or more recorded parts of a workshop, and does not change afterwards. It has a name (or "Analys 1" until you give it one), its own page in the sidebar under Analyser, a chat, and it is what you share with a client or drop into a report.
The four parts of an analys
- Text, a written summary of the discussion, laid out as an editable document.
- Insiktsrapport, key themes, questions and takeaways, organised as cards.
- Presentation, a slide deck of the results, ready to edit and export.
- Sketchnote, a hand-drawn visual summary of the parts you chose.
The text part reads the transcripts of the chosen parts and writes them up as a short, scannable document (the point first, short paragraphs, the tables by their names); the page itself is the editor, so you type into any block where it is, and the floating box under it asks the AI to change something and shows the change land. Ladda ner som Word (.docx) sits under Dela at the top right. See edit the text document with the AI. The insight report breaks the material into cards, themes, open questions and recommendations, with real quotes anchored to the transcript so you can click through to who said what and when. The presentation turns the analysis into a deck you can edit and export as PDF or PPTX. The sketchnote is a single hand-drawn image of the themes, for a wall or a report cover.
Add a part afterwards, or a card
Under the analys' items in the sidebar, Lägg till lists the parts it does not have yet, each with its one line; pick one and it is made in place and opens. The list also offers Kort, which is never one of the four at creation: the shareable card with the drawing, Ton, Idéer and Jämnhet over every part the analys reads, and the colours and the light or dark ground under it to style it. Adding a card to an analys without a sketchnote draws the picture first. The day's own card, Dagens kort under Analyser, is the same card and sits beside its Sketchnote, the drawing on its own.
Creating an analys
Read the analys for one group at a time
Under the small title Visar grupper in the left sidebar there is a group picker, Alla grupper by default. Tick the groups you want and the workspace narrows to them: the insight report's themes, signals and quotes, the airtime and word counts, the word cloud and the tone curve all redraw for that selection. This is instant and free; nothing is regenerated, because the analys records which group each theme, quote and measurement came from. A table linked across parts counts as one group here.
The text part and the chat follow the selection too. The written document is rebuilt from the groups you picked, and the chat answers only from them, including when it digs into the transcripts; changing the selection mid-conversation changes what the next answer draws on, it never starts a new chat.
FAQ
No. Pick only what you need, a quick insight report for yourself, or the full set for a stakeholder debrief.
An analys belongs to its workshop now, so you find it in that workshop's sidebar under Analyser, and make a new one there with Ny analys. Older analyses built from conversations in different workshops are listed at the bottom of home under Övriga analyser.
Yes. Tick one part. Make another analys over the whole day if you want both; the Härnösand pattern is one per part and one for the day.
Generera analys fills a conversation's living analysis after the fact, for a recording made before it existed. Ny analys makes a deliverable. See why an older conversation has no analysis.
No. It is a view filter. Nothing is regenerated, nothing is saved over, and Alla grupper restores the full picture.
Only if you add one: Lägg till, then Kort. The day's card, Dagens kort, belongs to the workshop and grows after each part; a card on an analys counts the parts that analys reads.